可观测性
鼻祖 Dapper, a Large-Scale Distributed Systems Tracing Infrastructure(2010)
OpenTelemetry 统一标准合并(OpenTracing 和 OpenCensus)
- Traces:业界认可度最高,新项目优先 OTLP
- Metrics:两条路线并存(Prometheus Pull / OTLP Push)
- Logs:争议最大、落地最慢,不强求一定要走 OTLP
Metrics (指标) :只有聚合数字,没有单次请求/处理细节
Logs (日志):一条一条的记录,本身是离散事件,没有任何直接关系,携带 trace_id 关联链路
Trace (链路):完整记录这条 trace_id 请求从头到尾所有(分布式)调用、每一段耗时、调用父子关系;Span表示跨服务的一次调用,多个 Span 组合成一次 Trace 追踪记录。

Metrics SDK
Counter(计数器):只能递增,不能减少;可重置(进程重启归零);
Gauge(仪表盘):代表当前时刻的值,任意上下浮动,瞬时快照值;
Histogram(直方图):记录观测样本落在各个区间(bucket,预定义,不可调)的数量,服务端可以动态计算分位数,用于分布统计;
Summary(摘要):客户端直接预先计算分位数,不能多实例聚合,分位数固定设置;
节点指标 Node Exporter
Go 二进制提供,隶属Prometheus 生态,用于获取节点的基本运行信息。
业务指标 Prometheus SDK
Pull 模型,业务进程内置指标内存状态,暴露 /metrics HTTP 接口;Prometheus 主动定期拉取。
指标采集存储
Prometheus:单机本地磁盘,原生 Pull 模型,无自动降采样,到期直接删原始数据。
Grafana Alloy:统一采集(metrics/log/trace)转发器,Pull/Push都支持。没有本地持久化时序数据库、不提供 PromQL 查询、不能评估告警规则 。一般每个节点部署 Daemon。
分布式有 Grafana Mimir(Cortex 继任者),Thanos等。
Prometheus
采集 + 存储
remote_write: Prometheus 在采集到指标之后,额外异步把样本推送到远端时序存储服务(HTTP 推送模式)。Prometheus Agent 模式是 Prometheus v2.32.0 引入的一项新特性,旨在优化指标抓取和远程写入的能力。Agent 模式禁用了 Prometheus 的查询、告警和本地存储功能,专注于指标的抓取和远程写入。
架构
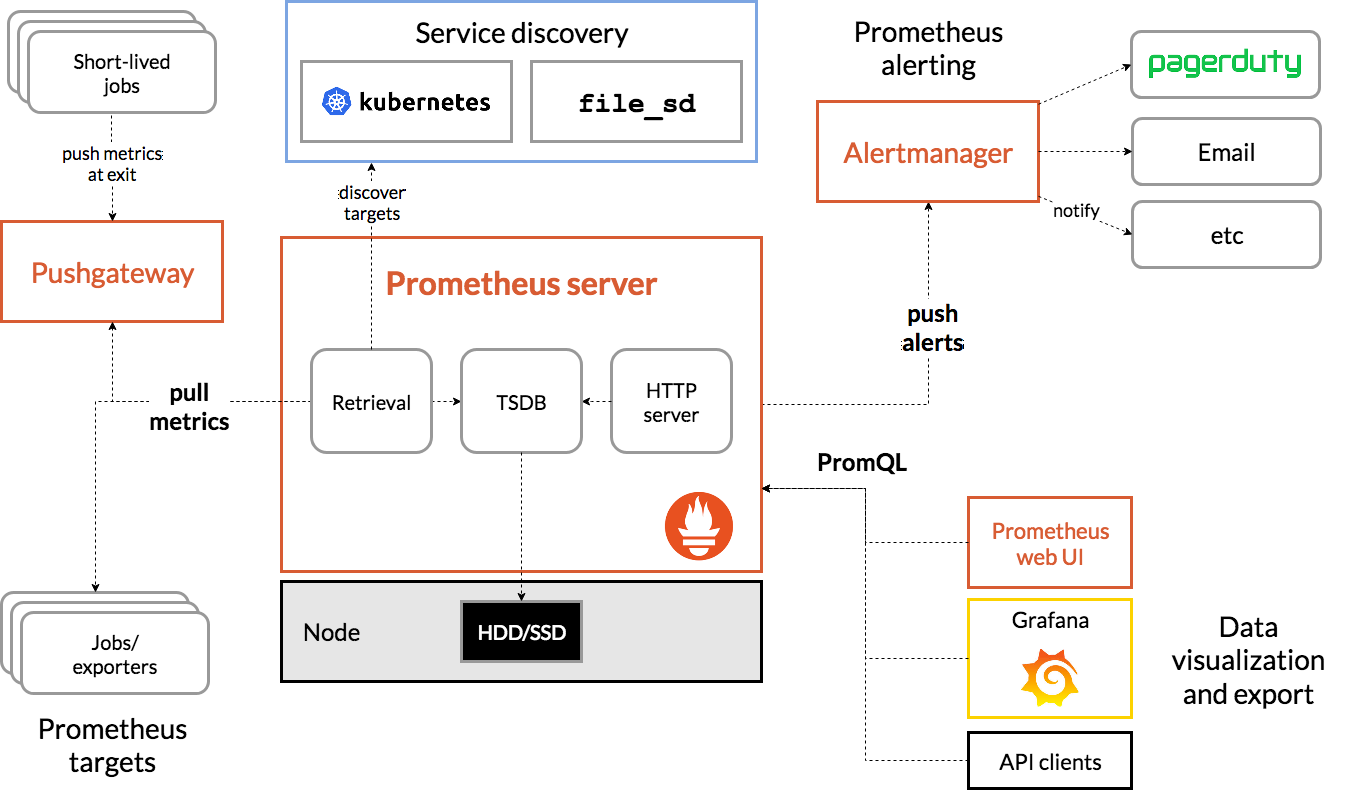
Prometheus的基本原理是通过HTTP协议周期性抓取被监控组件的状态。
- 支持配置目标服务动态发现:通过
http接口定时获取所有target信息; - 在本地存储抓取的所有数据,并通过一定规则进行清理和整理数据,并把得到的结果存储到新的时间序列中
单机限制
- 采集压力:(经验值)单实例无远程存储,常规稳定上限 10 万~25 万 samples/sec(取决于磁盘、标签基数)
# 每次scrape平均耗时,超过scrapeinterval说明采集过载
prometheus_target_interval_length_seconds_sum / prometheus_target_interval_length_seconds_count

# 采集超时的 target 占比(高危信号)
sum by (job)(prometheus_target_scrapes_exceeded_sample_scrape_timeout_total) / sum by (job)(prometheus_target_scrapes_total)

# 样本丢弃数量:资源不足、采样超限、超时都会丢样本
prometheus_tsdb_samples_discarded_total

# 采样吞吐:每秒摄入样本量
rate(prometheus_tsdb_head_samples_appended_total[5m])
- TSDB 存储压力:(经验值)普通机械盘:单实例建议 series < 150 万;SSD:可控到 300 万~500 万 series
- 活跃时序:如果一个时序最近有被抓取到新数据,那么称它为活跃的
# Head 区块占用内存(内存头号杀手)
prometheus_tsdb_head_series

# 当前时序数量 series(核心指标!series爆炸是最经典上限问题)
prometheus_tsdb_head_series

# 时序增长率:持续上涨不回落=标签基数失控
rate(prometheus_tsdb_head_series[10m])

# 块持久化阻塞,说明磁盘IO跟不上
prometheus_tsdb_blocks_loaded

# WAL 写入延迟、积压
rate(prometheus_tsdb_wal_writes_failed_total[5m])
- 查询&规则压力
# 查询执行耗时、慢查询占比
prometheus_engine_query_duration_seconds_sum / prometheus_engine_query_duration_seconds_count

# 规则评估积压(告警/recording rule 跑不完)
prometheus_rule_evaluation_duration_seconds_sum / prometheus_rule_evaluation_duration_seconds_count

# 规则错过评估(关键上限信号!规则周期内无法完成计算)
rate(prometheus_rule_evaluations_missed_total[5m]) > 0
- 远程读写(启用 remote_write 时)
# remote write队列积压
prometheus_remote_storage_pending_samples

# remote write发送失败
rate(prometheus_remote_storage_samples_failed_total[5m])
- 运行指标
# GC频率、GC耗时过高代表内存压力大
rate(go_gc_duration_seconds_count[5m])
quantile(0.9, go_gc_duration_seconds)

# CPU:进程CPU使用率
rate(process_cpu_seconds_total[5m])
配置
启动时:--storage.tsdb.retention=90d,数据的保留时间。
global:
  scrape_interval:     15s # Set the scrape interval to every 15 seconds. Default is every 1 minute.
  evaluation_interval: 15s # Evaluate rules every 15 seconds. The default is every 1 minute.
  # scrape_timeout is set to the global default (10s).

# Alertmanager configuration
alerting:
  alertmanagers:
  - static_configs:
    - targets:
      # - alertmanager:9093

# Load rules once and periodically evaluate them according to the global 'evaluation_interval'.
rule_files:
  # - "first_rules.yml"
  # - "second_rules.yml"

# A scrape configuration containing exactly one endpoint to scrape:
# Here it's Prometheus itself.
scrape_configs:
  # The job name is added as a label `job=<job_name>` to any timeseries scraped from this config.
  - job_name: 'pushgateway'
    # 指标样本自身携带的标签优先级更高(默认 false),对于 PushGateway 指标需要设置 true
    honor_labels: true
    # metrics_path defaults to '/metrics'
    # scheme defaults to 'http'.
    static_configs:
    - targets: ['localhost:9090']
短时作业
PushGateway:解决 短时一次性任务(CronJob、批处理脚本),任务执行过程,主动 Push 指标到 PushGateway,Prometheus 再从 Gateway 拉取。
- 无法自动清理实例时序,容易堆积陈旧指标,需要管理服务去清理不再运行的任务指标。
Alloy 也支持应用主动 push metrics,其指标会主动推给(remote-write 模式) Prometheus(而不是 prometheus 拉取),因此作业结束后,指标就消失。
Logging SDK
一般的流程:通过本地采集解耦,不同语言的日志库都支持写到本地文件
- 日志写文件 —> 本地采集 —> 日志存储
日志采集存储
采集:
- ES FileBeat:只处理转发日志,支持基础过滤、json 解析;复杂清洗依赖 Logstash;
- Grafana Alloy:统一采集(Metrics / Logs / Traces / Profiles)网关(新一代 Agent)
存储:
-
Elasticsearch:全文检索能力天花板,复杂文本查询、堆栈检索极强,资源大
-
Grafana Loki:不存全文索引,只构建标签索引,磁盘占用远低于 ES
Trace SDK
对于Tarce的处理采用批量上报的形式,一定阈值或者一定时间间隔。
Trace 的处理流程(推送模式):应用 → 节点侧采集网关(Alloy/OTel Collector)→ Tempo。
采样器决定这条 Trace 是否被完整上报(10% 采样)。不采样:依然生成 traceId、正常写入日志,但是 Span 不会发给 Collector。
- 头采样(Head-based Sampling) 请求一开始就决定采不采。缺点:请求刚进来不知道后续会不会报错,可能漏掉异常请求。下游服务需要根据上有服务字段决定要不要发送。
- 尾采样(Tail-based Sampling,部署在 Collector) 客户端无条件先把所有 Trace 发给 Collector;Collector 等整条链路完成,看到异常、慢请求就保留,正常请求按比例丢弃。
OpenTelemetry (OTel) SDK :CNCF 项目,设计 metrics/logs/traces(推送模式),全语言覆盖,行业新标准。
- 提供多语言的自动埋点工具:
Trace 采集存储
采集:
-
OpenTelemetry Collector :只围绕 OTLP 协议构建,处理 metrics/logs/traces。分为 receiver、processor、exporter 等组件,原生不支持 Prometheus scrape 等(有三方库)。
-
Grafana Alloy:统一采集(Metrics / Logs / Traces / Profiles)网关(新一代 Agent),为 Prometheus 生态深度优化。
存储:
- Grafana Tempo:支持 TraceQL 检索、自动 TTL 清理,无 UI,使用对象存储;
- Jaeger:Trace 系统,包含所有组件,原生接收 OTLP,功能和UI 相对 Zipkin 更丰富,支持 ES 等存储;
展示
Grafana: 统一支持 metrics/logs/traces 的展示。
默认的使用的是嵌入式SQLite,直接在本地存储,可以修改如下配置:
# Either "mysql", "postgres" or "sqlite3", it's your choice
type = sqlite3
host = 127.0.0.1:3306
name = grafana
user = root
# If the password contains # or ; you have to wrap it with triple quotes. Ex """#password;"""
password =
# Use either URL or the previous fields to configure the database
# Example: mysql://user:secret@host:port/database
url =
其它一体化
Apache SkyWalking:分布式系统的应用程序性能监视(APM)工具,支持 metrics/logs/traces,自研协议、支持OTLP转换,专为微服务、云原生架构和基于容器(Docker、K8s、Mesos)架构而设计,提供多语言的自动埋点 Agent 库。
OpenObserve:OTel 原生、统一存储 Logs/Metrics/Traces,可以使用 Otel 官方埋点库。
Sentry :专注「异常崩溃、堆栈快照、错误聚合」的开发者导向错误追踪平台。