Prometheus
服务监控系统和时间序列数据库。
一个监控系统,它不仅仅包含了时间序列数据库,还有全套的抓取、检索、绘图(集成Grafana)、报警的功能。
时间戳是 Prometheus 的采集(Pull)时间。
架构
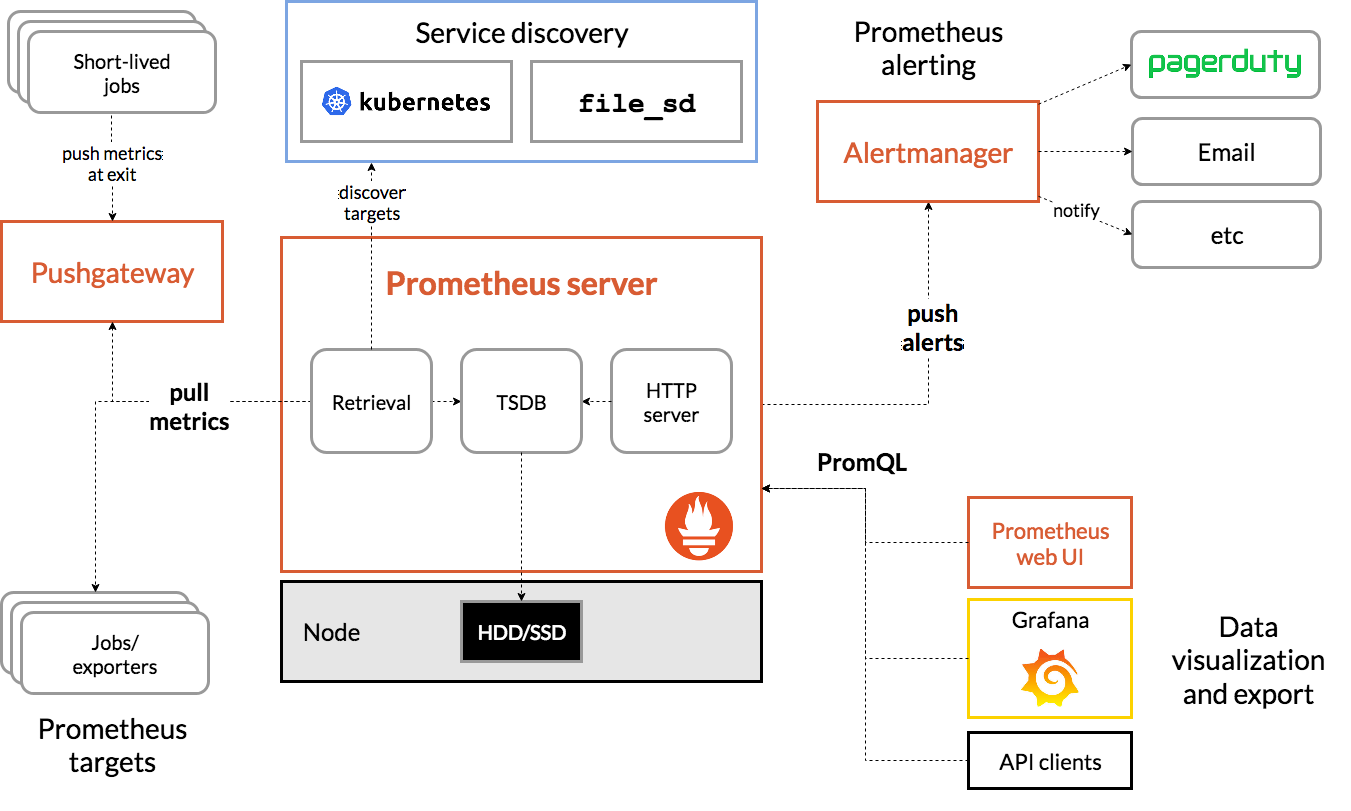
基本原理
Prometheus的基本原理是通过HTTP协议周期性抓取被监控组件的状态。
服务过程
- Prometheus Daemon负责定时去目标上抓取metrics(指标)数据,每个抓取目标需要暴露一个http服务的接口给它定时抓取。Prometheus支持通过配置文件、文本文件、Zookeeper、Consul、DNS SRV Lookup等方式指定抓取目标。Prometheus采用PULL的方式进行监控,即服务器可以直接通过目标PULL数据或者间接地通过中间网关来Push数据。
- Prometheus在本地存储抓取的所有数据,并通过一定规则进行清理和整理数据,并把得到的结果存储到新的时间序列中。
- Prometheus支持很多方式的图表可视化,例如Grafana、自带的Promdash以及自身提供的模版引擎等等。Prometheus还提供HTTP API的查询方式,自定义所需要的输出。
- PushGateway支持Client主动推送metrics到PushGateway,而Prometheus只是定时去Gateway上抓取数据。
- Alertmanager是独立于Prometheus的一个组件,可以支持Prometheus的查询语句,提供十分灵活的报警方式。
三大套件
- Server 主要负责数据采集和存储,提供PromQL查询语言的支持。
- Alertmanager 警告管理器,用来进行报警。
- Push Gateway 支持临时性Job主动推送指标的中间网关。
服务发现
prometheus是通过server端配置里的targets来获取监控对象的,targets 依赖discovery模块进行获取源。
静态配置
修改配置文件prometheus.yml,然后重启 Prometheus
  - job_name: 'nodes'
    static_configs:    #静态配置
    - targets:
       - 172.16.78.12:9100  #node_exporter启动端口
       - 172.16.78.18:9100
       - 172.16.78.13:9100
动态发现
基于服务注册中心自动发现、检测、分类可被监控的各target,目前支持:
- 文件(实时)、HTTP(轮询);
- consul,eureka,zookeeper;
- DNS,K8s;
K8s(TODO)
集群监控
联邦机制
- 主节点配置文件可以配置从节点的地址池,主节点只要定时向从节点拉取数据即可,主节点的作用就是存贮实时数据,并提供给grafana 使用。而从节点作用就是分别从不同的各个采集端中抽取数据,可以实现分机器或者分角色。
Prometheus社区提供了远程读写两个接口,使用一些社区的时序数据库方案,来扩展prometheus。
Thanos
Cortex
A horizontally scalable, highly available, multi-tenant, long term Prometheus
部署
yaml 配置
global:
  scrape_interval:     15s # By default, scrape targets every 15 seconds.

  # Attach these labels to any time series or alerts when communicating with
  # external systems (federation, remote storage, Alertmanager).
  external_labels:
    monitor: 'codelab-monitor'

# A scrape configuration containing exactly one endpoint to scrape:
# Here it's Prometheus itself.
scrape_configs:
  # The job name is added as a label `job=<job_name>` to any timeseries scraped from this config.
  - job_name: 'prometheus'
    # Override the global default and scrape targets from this job every 5 seconds.
    scrape_interval: 5s
    static_configs:
      - targets: ['localhost:9090']
    metrics_path: '/metrics/executors/prometheus'
docker pull prom/node-exporter
docker run -d -p 9100:9100 \
  -v "/proc:/host/proc:ro" \
  -v "/sys:/host/sys:ro" \
  -v "/:/rootfs:ro" \
  prom/node-exporter

docker pull prom/prometheus
docker run  -d \
  -p 9090:9090 \
  -v /home/workspace/prometheus/prometheus.yml:/etc/prometheus/prometheus.yml  \
  prom/prometheus
配置
启动时:--storage.tsdb.retention=90d,数据的保留时间。
global:
  scrape_interval:     15s # Set the scrape interval to every 15 seconds. Default is every 1 minute.
  evaluation_interval: 15s # Evaluate rules every 15 seconds. The default is every 1 minute.
  # scrape_timeout is set to the global default (10s).

# Alertmanager configuration
alerting:
  alertmanagers:
  - static_configs:
    - targets:
      # - alertmanager:9093

# Load rules once and periodically evaluate them according to the global 'evaluation_interval'.
rule_files:
  # - "first_rules.yml"
  # - "second_rules.yml"

# A scrape configuration containing exactly one endpoint to scrape:
# Here it's Prometheus itself.
scrape_configs:
  # The job name is added as a label `job=<job_name>` to any timeseries scraped from this config.
  - job_name: 'prometheus'
    # metrics_path defaults to '/metrics'
    # scheme defaults to 'http'.
    static_configs:
    - targets: ['localhost:9090']
Gateway
允许临时和批处理作业向 Prometheus 暴露其指标
- Pushgateway 持久化推送给它的监控数据,即使监控已下线,Prometheus 还会拉取到旧数据,需手动清理 Pushgateway 不要的数据。
客户端使用push的方式上报监控数据到pushgateway,prometheus会定期从pushgateway拉取数据。
场景:
- Prometheus 采用 pull 模式,可能由于不在一个子网或者防火墙原因,Prometheus 无法拉取数据;
- 没有端口可以暴露metrics,或者Job启动周期太短;
劣势:
- gateway会成为瓶颈,单点故障;
- 丢失自动的实例监控,只能监控到 gateway 状态;
- 必须手动删除任何过时的指标,否则 Prometheus 会一直拉取到旧数据。
Gateway 配置
默认情况下 Pushgateway 不保留指标:
--persistence.file标志允许指定一个文件,将推送的指标保存在其中,这样当 Pushgateway 重新启动后指标仍然存在。
Prometheus配置
/etc/prometheus/prometheus.yml
  - job_name: "pushgateway"
    honor_labels: true          #检测是否有重复的标签
    static_configs:
    - targets: ["127.0.0.1:19090"]
当prometheus拉取目标时,它会自动添加一些标签到时间序列中,用于标识被拉取的目标:
- job:目标所属的任务名称
- instance:targets的 ip:port
从 pushgateway 抓取的指标的instance label 为 pushgateway 的主机和端口配置。这可能会和你附加推送到 Pushgateway 指标上的 job 和 instance 标签冲突,这个时候 Prometheus 会将这些标签重命名为 exported_job 和 exported_instance。
希望保留推送到 Pushgateway 的指标的 job 和 instance 标签,这个时候只需要在 Pushgateway 的抓取配置中设置 honor_labels: true。
使用
Prometheus Client SDK 推送和 API 推送。
自实现
https://github.com/prometheus/client_java#exporting
数据格式
metrics数据都包含:指标名称、标签和采样数据。
- 指标名称:支持ASCII字符、数字、下划线和冒号,如
node_cpu_seconds_total; - 标签:K/V格式,区分不同的实例,如
node_network_receive_bytes_total{device="eth0"} #表示eth0网卡的数据; - 采样数据:包括一个float64值,和毫秒级的unix时间戳;
Metric类型
Counter(计数器),Gauge(仪表盘),Histogram(直方图),Summary(摘要)